Exchange Rates and Interest Rates: An Application of the ECODATA Package
James M. Murray
University of Wisconsin-La Crossejmurray@uwlax.edu
Created on October 31, 2024
exchangerates_interestrates.RmdIn this vignette, we will use the ecodata package to compare interest rate changes in the United States and the United Kingdom and visualize the impact of these changes on the exchange rate between the two countries.
Prompts
Download data on the USD/GBP exchange rate and interest rates for the United States and the United Kingdom. Make sure to use interest rates that are directly comparable (i.e. interest rates for the same type of asset)
Plot the interest rates for the two countries on the same graph for just the year 2022. What do you observe?
Plot the exchange rate between the two countries for just the year 2022. What do you observe?
What is the impact of the interest rate changes on the exchange rate? Use the supply and demand model for currencies to describe and illustrate the expected impact. Did the model predict what you see in the data?
Download Data
The following are the variables for the USD/GBP exchange rate and interest rates for the two countries:
Exchange Rate: https://fred.stlouisfed.org/series/DEXUSUK
Interest Rate United States: https://fred.stlouisfed.org/series/MSPNHSUS
Interest Rate United Kingdom: https://fred.stlouisfed.org/series/NHSUSSPT
Load the tidyverse and ecodata libraries and download the data:
library(tidyverse)
library(ecodata)

# Identify the data
data_sources <- c(
  "https://fred.stlouisfed.org/series/IR3TIB01USM156N",
  "https://fred.stlouisfed.org/series/IR3TIB01GBM156N",
  "https://fred.stlouisfed.org/series/DEXUSUK"
)
variable_names <- c("Interest Rate United States", "Interest Rate United Kingdom", "USD / GBP Exchange Rate")

# Download the data
mydata <- get_ecodata(data_sources, variable_names)

# Filter only for 2022
mydata <- mydata |>
  filter(Date >= "2022-01-01", Date <= "2022-12-31")

# View the data
glimpse(mydata)
#>
#> Rows: 253
#> Columns: 4
#> $ Date <date> 2022-01-01, 2022-01-03, 2022-01-04, 20…
#> $ `Interest Rate United States` <dbl> 0.22, NA, NA, NA, NA, NA, NA, NA, NA, N…
#> $ `Interest Rate United Kingdom` <dbl> 0.53, NA, NA, NA, NA, NA, NA, NA, NA, N…
#> $ `USD / GBP Exchange Rate` <dbl> NA, 1.3469, 1.3544, 1.3573, 1.3539, 1.3…
ecodata_description_table(mydata)Variable |
Code |
Description |
Frequency |
Units |
Seasonal Adjustment |
Source |
URL |
Access Date |
|---|---|---|---|---|---|---|---|---|
Interest Rate United States |
IR3TIB01USM156N |
Interest Rates: 3-Month or 90-Day Rates and Yields: Interbank Rates: Total for United States |
Monthly |
% |
Not Seasonally Adjusted |
FRED (R) Federal Reserve Bank of St. Louis |
October 31, 2024 |
|
Interest Rate United Kingdom |
IR3TIB01GBM156N |
Interest Rates: 3-Month or 90-Day Rates and Yields: Interbank Rates: Total for United Kingdom |
Monthly |
% |
Not Seasonally Adjusted |
FRED (R) Federal Reserve Bank of St. Louis |
October 31, 2024 |
|
USD / GBP Exchange Rate |
DEXUSUK |
U.S. Dollars to U.K. Pound Sterling Spot Exchange Rate |
Daily |
U.S. $ to 1 U.K. Pound Sterling |
Not Seasonally Adjusted |
FRED (R) Federal Reserve Bank of St. Louis |
October 31, 2024 |
Plot the data
Interest Rates
Below we plot the two interest rates on the same graph.
# Plot the interest rates
ggplot_ecodata_ts(mydata,
                  variables = c("Interest Rate United States", "Interest Rate United Kingdom"),
                  title = "Interest Rates in the U.S. and U.K.")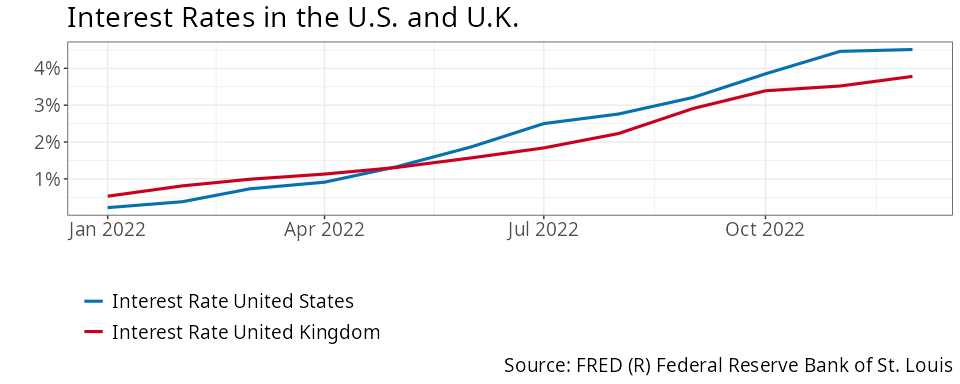
We can see that interest rates rose in both countries in 2022, but the increase in the was higher in the United States than the United Kingdom.
Exchange Rate
# Plot the interest rates
ggplot_ecodata_ts(mydata,
                  variables = "USD / GBP Exchange Rate",
                  title = "USD / GDP Exchange Rate")
We see that the exchange rate decreased over the year. Since the exchange rate is expressed with GBP as the denominator, a decrease in the exchange rate means that the U.K. pound depreciated against the U.S. dollar. This is equivalent to the U.S. dollar appreciated against the U.K. pound.
Observations
The interest rate in the United States increased more than in the United Kingdom over 2022, and at the same time there was an appreciation of the U.S. dollar against the U.K. pound.
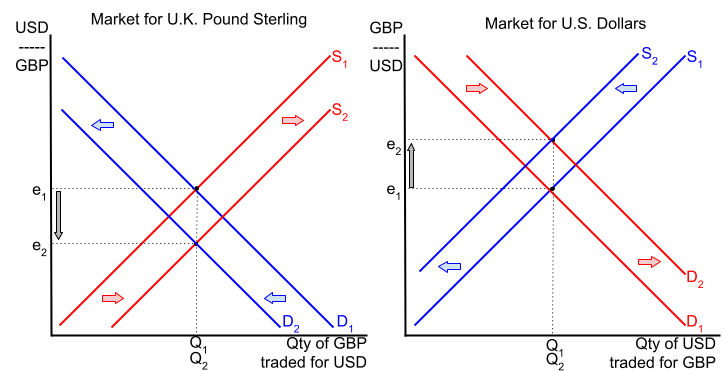
Currency Supply and Demand
The larger increase in the interest rate in the United States compared to the United Kingdom would attract financial investors in the U.K. to U.S. financial markets. This leads to an increase the demand for U.S. dollars / increase in the supply of U.K. pounds.
The relatively lower interest rates in the U.K. would lead American financial investors to invest less in the UK. This would decrease the demand for U.K. pounds / decrease the supply of U.S. dollars.
The plot below reveals that when these shifts happen, the U.S. dollar appreciates relative to the U.K. pound, and the U.K. pounds depreciates relative to the U.S. dollar. This is consistent with what we saw in the data.