Housing Prices: A Supply and Demand Application of the ecodata Package
James M. Murray
University of Wisconsin-La Crossejmurray@uwlax.edu
Created on October 31, 2024
supply_demand_housing.RmdIn this vignette, we will look at new housing construction costs, new housing sales prices, and the quantity of new house sales in the United States from 2021-2022, and use supply and demand reasoning to explain what happened in the U.S. housing market.
Prompts
Download data from FRED on median sales price for new houses in the United States for 2021-2022.
Download data from FRED on the number of sales for all new houses in the United States for 2021-2022 (hint: FRED describes this as “New Houses Sold by Sales Price in the United States, Total”).
Download data from FRED on construction costs for residential houses for 2021-2022 (hint: FRED describes this as “Producer Price Index by Commodity: Inputs to Residential Construction: New Housing Units Under Construction”).
Create time series plots for each of the three variables above.
Describe the behavior of each variable over 2021-2022.
Use the supply and demand model for new housing to explain what happened.
Download Data
The following are the variables for median sales price, number of sales, and construction cost index:
Median sales price: https://fred.stlouisfed.org/series/MSPNHSUS
Number of sales: https://fred.stlouisfed.org/series/NHSUSSPT
Construction cost index: https://fred.stlouisfed.org/series/WPUIP2311001
Load the tidyverse and ecodata libraries and download the data:
library(tidyverse)
library(ecodata)

# Identify the data
data_sources <- c(
  "https://fred.stlouisfed.org/series/MSPNHSUS",
  "https://fred.stlouisfed.org/series/NHSUSSPT",
  "https://fred.stlouisfed.org/series/WPUIP2311001"
)
variable_names <- c("Median Sales Price", "Number of Sales", "Construction Cost Index")

# Download the data
housingdata <- get_ecodata(data_sources, variable_names)

# Filter for only 2021-2022
housingdata <- housingdata |>
  filter(Date >= "2021-01-01", Date <= "2022-12-31")

# View the data
glimpse(housingdata)
#>
#> Rows: 24
#> Columns: 4
#> $ Date <date> 2021-01-01, 2021-02-01, 2021-03-01, 2021-04…
#> $ `Median Sales Price` <dbl> 354800, 351400, 342700, 364400, 372700, 3611…
#> $ `Number of Sales` <dbl> 77, 70, 83, 74, 65, 61, 62, 55, 58, 51, 54, …
#> $ `Construction Cost Index` <dbl> 240.600, 246.100, 253.600, 258.200, 268.100,…
ecodata_description_table(housingdata)Variable |
Code |
Description |
Frequency |
Units |
Seasonal Adjustment |
Source |
URL |
Access Date |
|---|---|---|---|---|---|---|---|---|
Median Sales Price |
MSPNHSUS |
Median Sales Price for New Houses Sold in the United States |
Monthly |
$ |
Not Seasonally Adjusted |
FRED (R) Federal Reserve Bank of St. Louis |
October 31, 2024 |
|
Number of Sales |
NHSUSSPT |
New Houses Sold by Sales Price in the United States, Total |
Monthly |
Thous. of Units |
Not Seasonally Adjusted |
FRED (R) Federal Reserve Bank of St. Louis |
October 31, 2024 |
|
Construction Cost Index |
WPUIP2311001 |
Producer Price Index by Commodity: Inputs to Industries: Net Inputs to Residential Construction, Goods |
Monthly |
Index Jun 1986=100 |
Not Seasonally Adjusted |
FRED (R) Federal Reserve Bank of St. Louis |
October 31, 2024 |
Plot the data
Since each variable is measured on a different scale (prices are in dollars, number of sales is in units, and the construction cost index is an index), we will plot each variable on a separate graph.
# Housing Prices
ggplot_ecodata_ts(housingdata,
                  variables = "Median Sales Price",
                  title = "Median Sales Price of New Houses in the U.S.",
ylab = "") 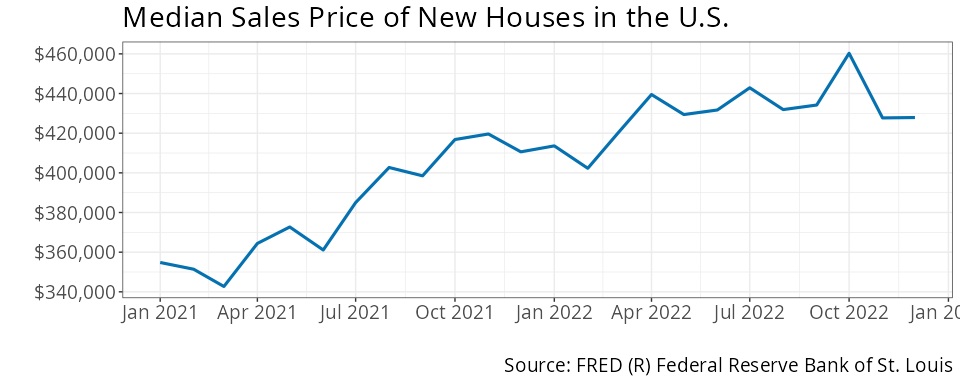
# Quantity of Sales
ggplot_ecodata_ts(housingdata,
                  variables = "Number of Sales",
                  title = "Number of New Houses Sold in the U.S.")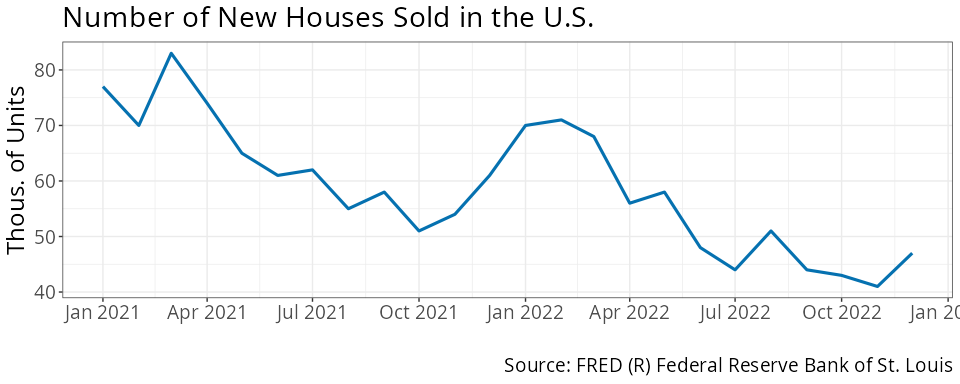
# Construction Costs
ggplot_ecodata_ts(housingdata,
                  variables = "Construction Cost Index",
                  title = "Construction Costs for New Houses in the U.S.")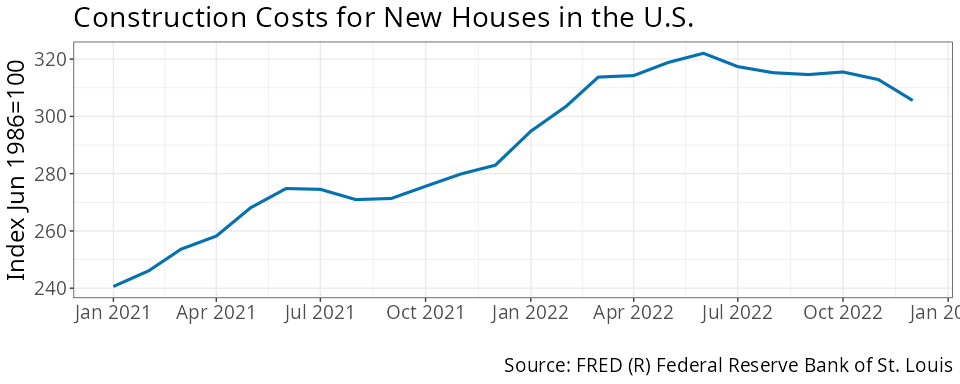
Observations
Construction costs increased from January 2021 until about July 2022. Over the two-year period 2021-2022, housing prices increased, but the quantity of new houses sold decreases.
Supply and Demand Analysis
An increase in construction costs increases the cost of producing new houses, which should lead to a decrease in supply. Below, we use a supply and demand model for new houses and shift the supply to the left.

The leftward shift in supply leads to a higher equilibrium price and a lower equilibrium quantity. This is consistent with the U.S. housing market data from 2021-2022.